EQ profiling your environment
[Be EQ aware of your sonic environment]
All rooms and environments consists of different (more or less) reflective materials that the sound source (instrument or loudspeakers) bounces against. All this will results in early reflections (sounds bouncing off nearby surfaces), reverberation and often frequency build-ups. This will also result in a "EQ profile" of that particular place and listening position. This is a guide to get some kind of idea on how to analyze and improve the awareness of your sonic environment.
Things to consider
- Please consider that applied sound is extremely complex (like music). However if your room has build-ups at certain frequencies, you will compensate for it thus making your mix sound good where you are sitting. But when changing listening environment some frequencies might be to strong or weak
- Tuning a room is like tuning an instrument
- Find analogies - Arena rock often have a low BPM. Why? In order for a concert to be more or less pleasing the music can't fight the place it is being reproduced in, in this case the arenas acoustics (sounds taking a long time bouncing off surfaces in a vast space)
Some Tools
First off, some useful tools for measuring.
- Good sound card (most sound cards today used for music production are of a very high quality)
- Measurement microphone (In these experiments I'm using a low cost Behringer ECM8000 with a generic calibration file)
- Decibel meter, Analyzer for iPhone / iPad App will suffice for this purpose
- Room EQ Wizard (a free and really great analyzer program for both mac and pc)
Set up your system
The equipment used in the following examples.
ADAM A5X speakers, Focusrite Forte USB sound card, Behringer EMC8000 measurement microphone.
In order to get Room EQ Wizard to work properly, you have to calibrate your system. In this example I'm using a Focusrite Forte sound card.
First set up a loop signal.

Go to Preferences and let Room EQ Wizard help you create a calibration file for your sound card.

Select a calibration file for the microphone. To bye a calibrated microphone can be quite expensive. For the inexpensive Behringer EMC8000, there are generic calibration files you can download here (I'm not sure how trustworthy they are, there should be manufacturing differences). Ideally you should have a microphone that has a calibration file attached to it.

Measurements

As stated in the Room EQ Wizard "Check Levels" section, set your loudspeaker output volume to 75 dB. I'm measuring this using the Analyzer App for iPhone/iPad at the microphone / listening position.

The following graph shows speakers and microphone placed in a 90 x 90 x 90 cm triangle simulation my listening environment. The measurements are made with two different speaker placements in the room and averaging tree different microphone positions.
Since I'm not using a super quality measurement microphone, I will be looking for resonant peaks / dips in my listening environment, especially the peaks since those are usually more audible then dips.

Red Graph - Loudspeaker position 1, average ECM8000 values from different angles. Clear resonant peak at +10 dB (above 75 dB) at 146 Hz, dip at 762 Hz (-9 dB), 1013 Hz (-9 dB) and a dip around -12 dB at 12 kHz.
Blue Graph - Loudspeaker position 2, average ECM8000 values from different angles. +5 dB peak (above 75 dB) at 106 Hz, -10 dB dip at 125 Hz, +4 dB peak at 196 and 246 Hz, -7 dB dip at 640 Hz and 1105 Hz
Please note, this room has no acoustic treatment what so ever! Don't use my measurements as a reference for your own environment, make your own.
Compensate with EQ
There are different ways of compensating the listening environment with EQ. First of all I would strongly recommend trying to address the acoustic problems physically in the room before using any software or EQ.
The brutal way to compensate the listening environment is with an EQ, inserted as the last instance in the master channel. This is something that has to be turned off if listening environment is changed (headphones or different listening environment) and when exporting / bouncing sound files. Please note, this is only for listening environment targeted towards your particular placement and loudspeaker positions.
Routing
For this analysis I'm using this setup.
Generate pink noise and render it out as a sound file (the purple / pink one at the bottom), then record that signal going out of your loudspeakers at 75 dB and record it with a measurement microphone at listening position (ears). Make sure there is no feed back from the microphone (turn off software monitoring).

The Mixer
- The recorded signal ECM8000 sends pre fader to AUX 6, the left channel
- The "L" AUX has two filters, Match EQ and Channel EQ (the Channel EQ is only used for analysis)
- The generated pink noise is being pre sent via Bus 7 to AUX channel "R", the right channel (clean)
- The summing channel (feed via Bus 8) has Voxengos SPAN for analysis only

The reason I'm hard panning L-R is for the Voxengo SPAN displaying both channels at the same time for comparison. This is what it looks like before any EQ is applied. The pink shows the pure digital pink noise, the "R" channel. The green represents the untreated recorded signal. Frequencies below 50 Hz is where my loudspeakers limitations becomes clear.

You can also use Logics own built in Channel EQ for this type of analysis

The image below depicts frequency analysis on the recorded channel. We can clearly identify the peak at 146 Hz in both images as well as dips like the one at around 762 Hz and the even greater dip at around 1120 Hz.

This is how it ideally should look like from the pure pink noise

Match EQ usage
This plug in is inserted in the "L" channel / aux, the recorded material. Set up Bus 7 (the pure pink noise channel) as side chain input. Start the playback and click the "Template learn" button. Let it play for a while until the curve stabilizes.

While still playing, click the Current learn button. Let it play for a while until the curve stabilizes.

Press the "Material match" button to hear the result

Some frequency's below 50 Hz should probably be smoothed out because of loudspeaker limits and the fact that I'm not using a sub woofer.

Compensated Pink Noise after Match EQ

Analysis after Match EQ with Channel EQ in the "L+R" channel

Not perfect but a bit smoother, right? Check the audio files below.
The Null Test
To check what's being filtered out you can use The Null Test. This can be done by sending filtered and the unfiltered sound to a mono AUX with one channels phase inverted. If the sound is identical they will cancel each other out and produce no sound.
Phase Invert one channel

The difference between the filtered and un-filtered sound.

Ideally the "pure pink noise" and the matched channel should cancel each other but the difference in my case is to great for this to happen.
Listen to the results
(Please use headphones for better sound judgment)
Un-matched result. Left ear plays the recorded sound, right ear plays pure digital pink noise
Matched result. Left ear plays the recorded sound, right ear plays pure digital pink noise
Can you hear the difference?
Files themselves
Pure Digital Pink Noise
44.1kHz 16bit WAV File
Unfiltered Recorded Pink Noise (ADAM A5X loudspeakers, ECM8000 microphone)
44.1kHz 16bit WAV File
What the EMC8000 is capturing was no at all what I heard with my own ears. The perceived sound was much more rich in frequency response. With this in mind, you have to be critical to the equipment used and ask yourself if it's reproducing what you are hearing with A/B listening.
Filtered / Compensated Recording using Match EQ in Logic
44.1kHz 16bit WAV File
Other ways of finding resonant peaks or dips in a rooms
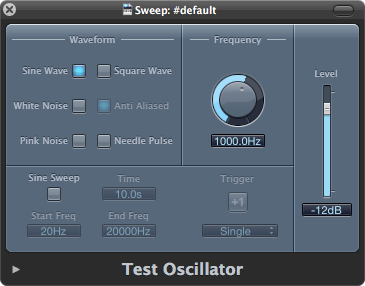
A more simple and immediate way of checking your listening environment is to do a manual frequency sweep with a tone generator using only your ears. Swipe slowly with the wheel and listen for frequency buildups and dips.
Another way is to generate the sound (pink noise) from one device and listening with an analyzer on another device. The example below depicts usage of the Analyzer iOS App:

Please note, the comments are mine and relates only to my environment
|•| – 2014-10-02
References
Read this as a good reference of what loudness is:
Avoid using the psycho acoustical terms loudness perception and volume. This subjective sound-sensation is not clearly measurable without ambiguity. The term "loudness" or "volume" is a problem because it belongs to psycho-acoustics and this personal feeling is not correct definable. Loudness as a psychological correlate of physical strength (amplitude) is also affected by parameters other than sound pressure, including frequency, bandwidth, spectral composition, information content, time structure, and the duration of exposure of the sound signal. The same sound will not create the same loudness perception by all individuals (people).
Our hearing is a sound pressure receptor, or a sound pressure sensor, because the eardrums (tympanic membranes) are moved by the sound pressure as a sound field quantity. That is the important effect of the excess sound pressure. It is not an energy receiver!
Source: www.sengpielaudio.com/TableOfSoundPressureLevels.htm
The Importance of Space in a Mix: Part II
theproaudiofiles.com/the-importance-of-space-in-a-mix-part-ii/